Time:2024-11-28
Today, we share a new generation of platelet receptor agonist - the stability study of specific impurities of Eltrombopag. Eltrombopag is a new generation of platelet receptor agonist, and its main function is to promote platelet growth. Eltrombopag is suitable for adult patients (aged 18 years or older) with chronic idiopathic thrombocytopenic purpura (ITP) who have had poor response to previous treatments such as glucocorticoids and immunoglobulin. It can increase platelet count and reduce or prevent bleeding. This product is only intended for ITP patients with increased risk of bleeding due to thrombocytopenia and clinical conditions. Eltrombopag is the first approved oral peptide thrombopoietin receptor agonist for the treatment of adult chronic ITP patients.
In this experiment, our center conducted a solution stability study on three specific impurities of Eltrombopag using chromatographic conditions based on our self-developed method. The sample item numbers and structural formulas used are shown in Figure 1 and Figure 2:
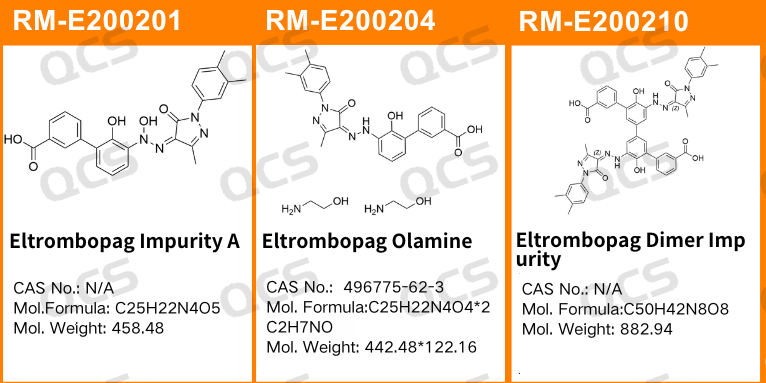
Figure 1: Impurity item numbers and structural formulas used in this study
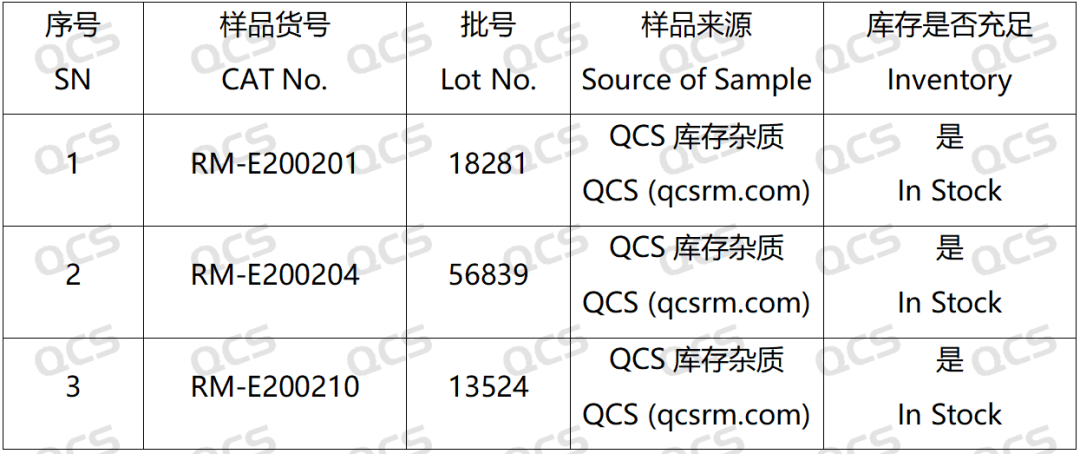
Figure 2: Correspondence between impurity codes included in the standard and impurity item numbers used in this study
In this experiment, the experimenter took appropriate amounts of RM-E200201(Eltrombopag Impurity A), RM-E200204(Eltrombopag Olamine; CAS NO: 496775-62-3), and RM-E200210(Eltrombopag Dimer Impurity) and placed them in acidic, neutral, and alkaline solutions, respectively, at room temperature and pressure for 0, 3, 6, 12, and 24 hours. After that, the samples were injected and tested according to the chromatographic conditions used in our self-developed method. Observe the changes in the peak area of the main peak in the chromatogram as the sample solution is left for an extended period of time, and use this as a basis to determine the stability of the sample solution. Our company's self-developed method is shown in the following figure:
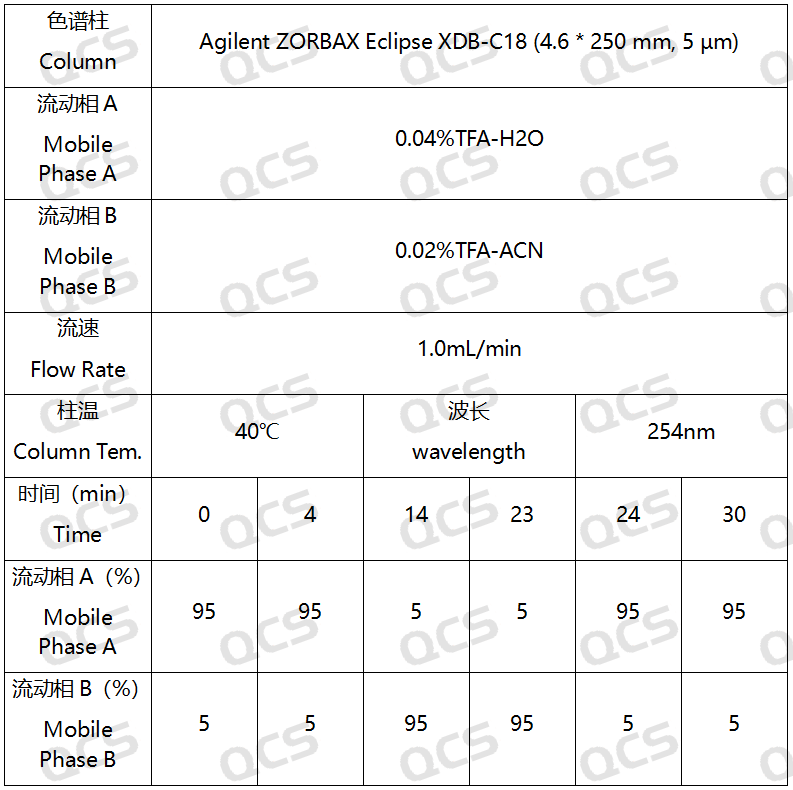
Figure 3: Chromatographic conditions of our company's self-developed analytical laboratory method
Experiment conclusion
After testing, it was found that the main peak area of sample RM-E200204 did not change significantly after being placed in acidic, neutral, and alkaline solutions for 24 hours, and the relative standard deviation was less than 2.0%. So it can be considered that the sample is relatively stable when placed in acidic, neutral, and alkaline solutions for 24 hours. The peak area data of the main peak at each detection point of sample RM-E200204 under various pH conditions are as follows:
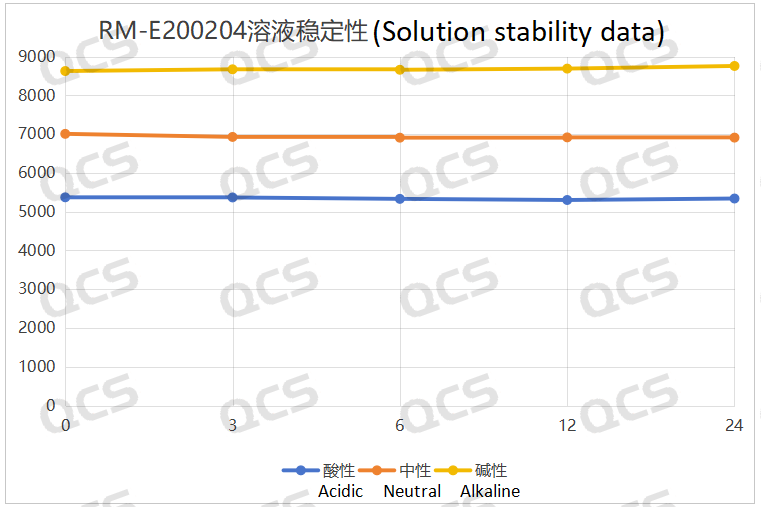
Figure 4: Summary line chart of solution stability data for sample RM-E200204
After testing, it was found that the main peak area of sample RM-E200201 did not change significantly after being placed in neutral and alkaline solutions for 24 hours, and the relative standard deviation was less than 2.0%. So it can be considered that the sample is relatively stable after being placed in neutral and alkaline solutions for 24 hours. However, during the 24-hour storage of the sample in acidic solution, the peak area of the main peak continuously decreased. From the detection spectrum, it can be seen that the chromatographic peak area at RT=2.2min was continuously decreasing, while the peak areas of other impurity peaks did not change significantly, and no other degradation impurity peaks appeared. So the stability of the sample in acidic solution is not yet clear, and further research is needed. The peak area data of the main peak at each detection point of sample RM-E200201 under different pH conditions are as follows
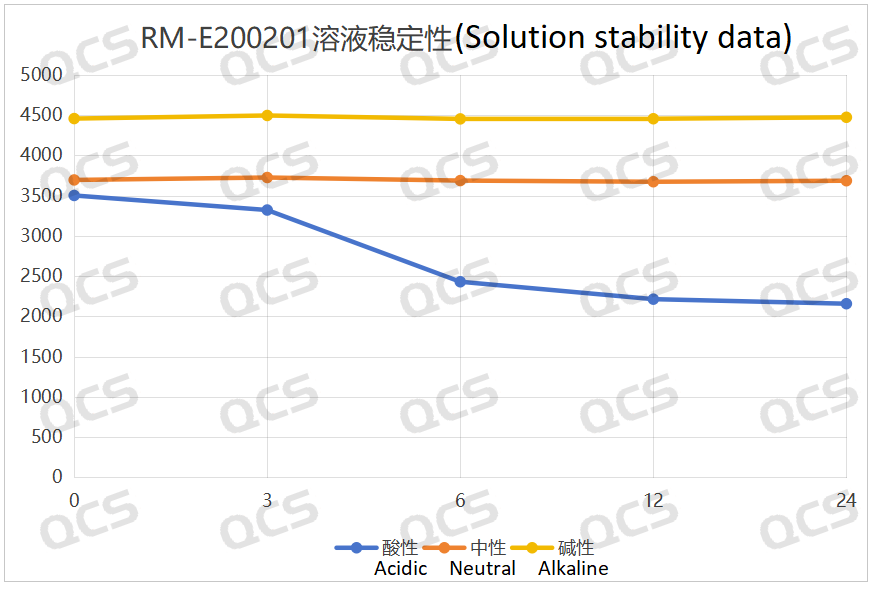
Figure 5: Summary line chart of solution stability data for sample RM-E200201
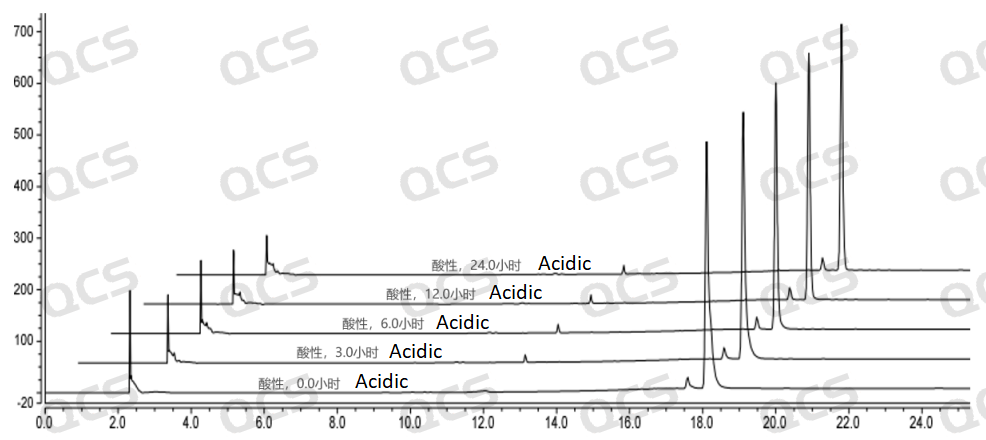
Figure 6: Summary of Acid solution stability data for sample RM-E200201
After testing, it was found that sample RM-E200210 has poor solubility in acidic and neutral solutions. The experimenter observed a large amount of precipitation after dissolving in acidic and neutral solvents. After centrifugation, the supernatant was filtered and injected. The main peak area of the detection spectrum is very small, and the quantification is inaccurate, so the stability of the sample in acidic and neutral solutions cannot be determined. The injection detection spectrum of sample RM-E200210 after being placed in alkaline solution for 0 hours showed that the main peak was split (RT=21.550 min and RT=21.863 min). After being placed for 3 hours, the injection detection spectrum showed that the main peak was no longer split (RT=21.900 min), and an additional impurity appeared after the main peak (RT=24.485 min). Moreover, with the extension of placement time, the peak area of this impurity continued to increase. The above graph information indicates that the sample will undergo degradation during the process of dissolution in alkaline solution, and will completely degrade after being left for 3 hours, and undergo secondary degradation. With the extension of storage time, secondary degradation will continue to occur. The experimenter conducted mass spectrometry analysis on the sample RM-E200210 after being placed in alkaline solution for 0 hours and 3 hours. The mass spectrum of the sample after being placed in alkaline solution for 0 hours showed impurity ion peaks, while the mass spectrum after being placed in alkaline solution for 3 hours showed an increase in impurity ion peaks and an increase in impurity ion peak abundance. The peak area data of the main peak at each detection point of sample RM-E200210 under different pH conditions are as follows.
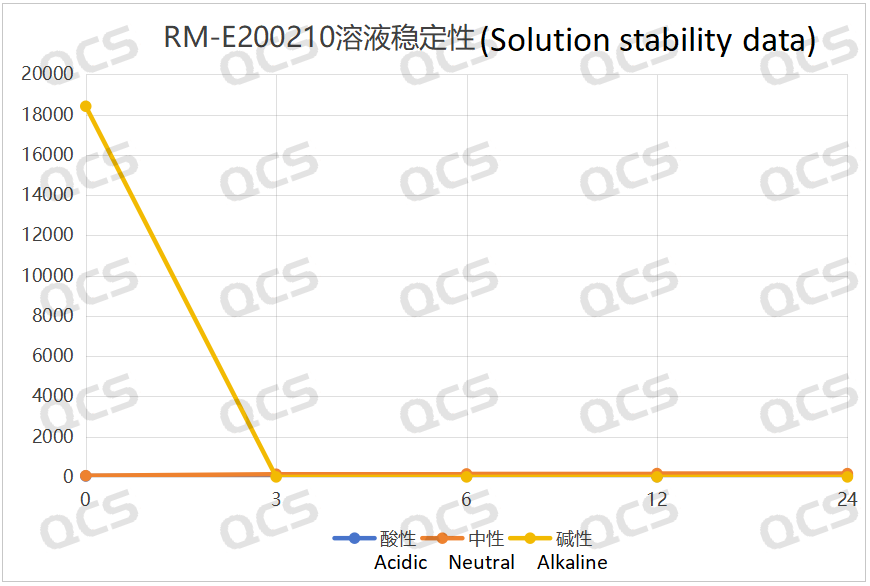
Figure 7: Summary line chart of solution stability data for sample RM-E200210
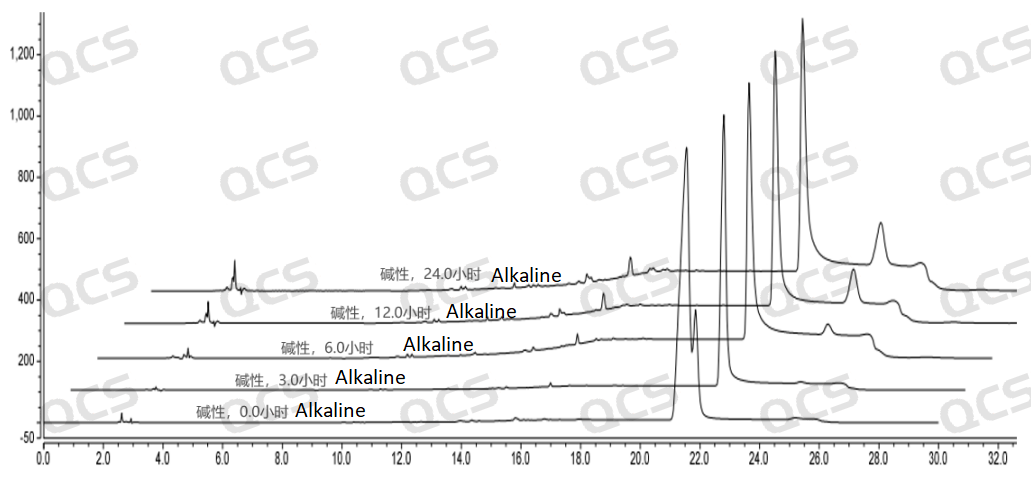
Figure 8: Summary of alkaline solution stability data for sample RM-E200210
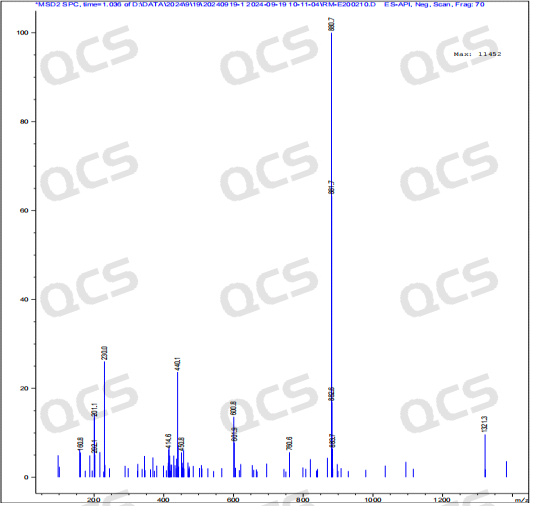
Figure 9: Mass spectrum of sample RM-E200210 after being placed in alkaline solution for 0 hours
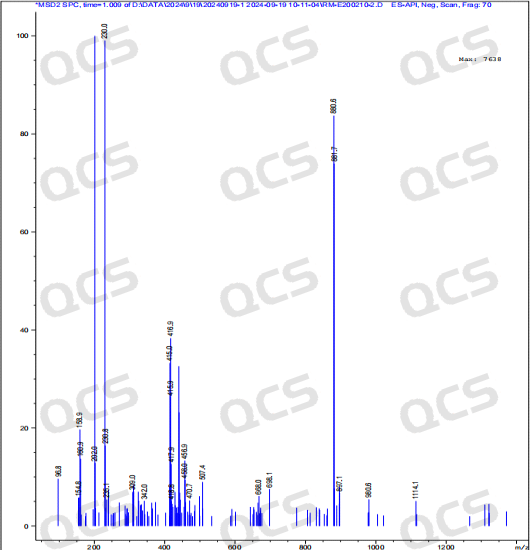
Figure 10: Mass spectrum of sample RM-E200210 after being placed in alkaline solution for 3 hours
Summary
In summary, through this experiment, we found that sample RM-E200204 has good stability in acidic, alkaline, and neutral solutions. The stability of sample RM-E200201 is good in both alkaline and neutral solutions, but its stability in acidic solutions is still unclear and requires further research. Sample RM-E200210 has poor solubility in acidic and neutral solutions, and degradation occurs during the process of dissolution in alkaline solutions. Moreover, degradation and secondary degradation continue to occur with prolonged storage time. Therefore, customers should avoid using alkaline diluents when testing sample RM-E200210, and should not touch alkali during use, storage, and transportation. If customers have a need for the stability of these 3 samples, welcome to consult our company.


CONTACT US
Service hotline: +86 0755-66853366
Marketing Department: +86 136 7004 6396 (WeChat)
Email: sales@chem-strong.com
Office address: Room 1201, Jiaye Plaza, No. 2055, Bixin Road, Longgang District, Shenzhen
*All of our products are for R&D use only, and cannot be used in human or animal clinical use